Systems · 2026
Tideline
The monitoring service behind every website OBdesign runs. Twice a month it checks each client site for the slow failures nobody notices, tells me only when something changed, and writes each client a plain-English report.
- Role
- Sole developer
- Timeline
- September 2026 – present
- Stack
- Python · FastAPI · AWS Lambda · Terraform · SQLite · EventBridge · CloudFront · pytest
- Live demo
- tideline.obwebdesign.ca ↗
OBdesign looks after 12 client websites, and until this month I had no way of knowing when one of them broke. I found out when a client emailed, or by accident.
The failures that actually happen to small-business sites are boring, and most of them are slow: a domain registration about to lapse, a certificate that stopped renewing, a contact form posting to an address that no longer exists, an email domain anyone can spoof. None of them take a site down on the day. All of them are the kind of thing a client finds before I do.
Tideline is the service I built to find them first. On the 1st and 15th of every month it checks every site, opens and closes incidents, emails me only when something changed, and on the 1st writes a report for each client in plain English. It never emails a client. Everything comes to me, and I decide what to forward.
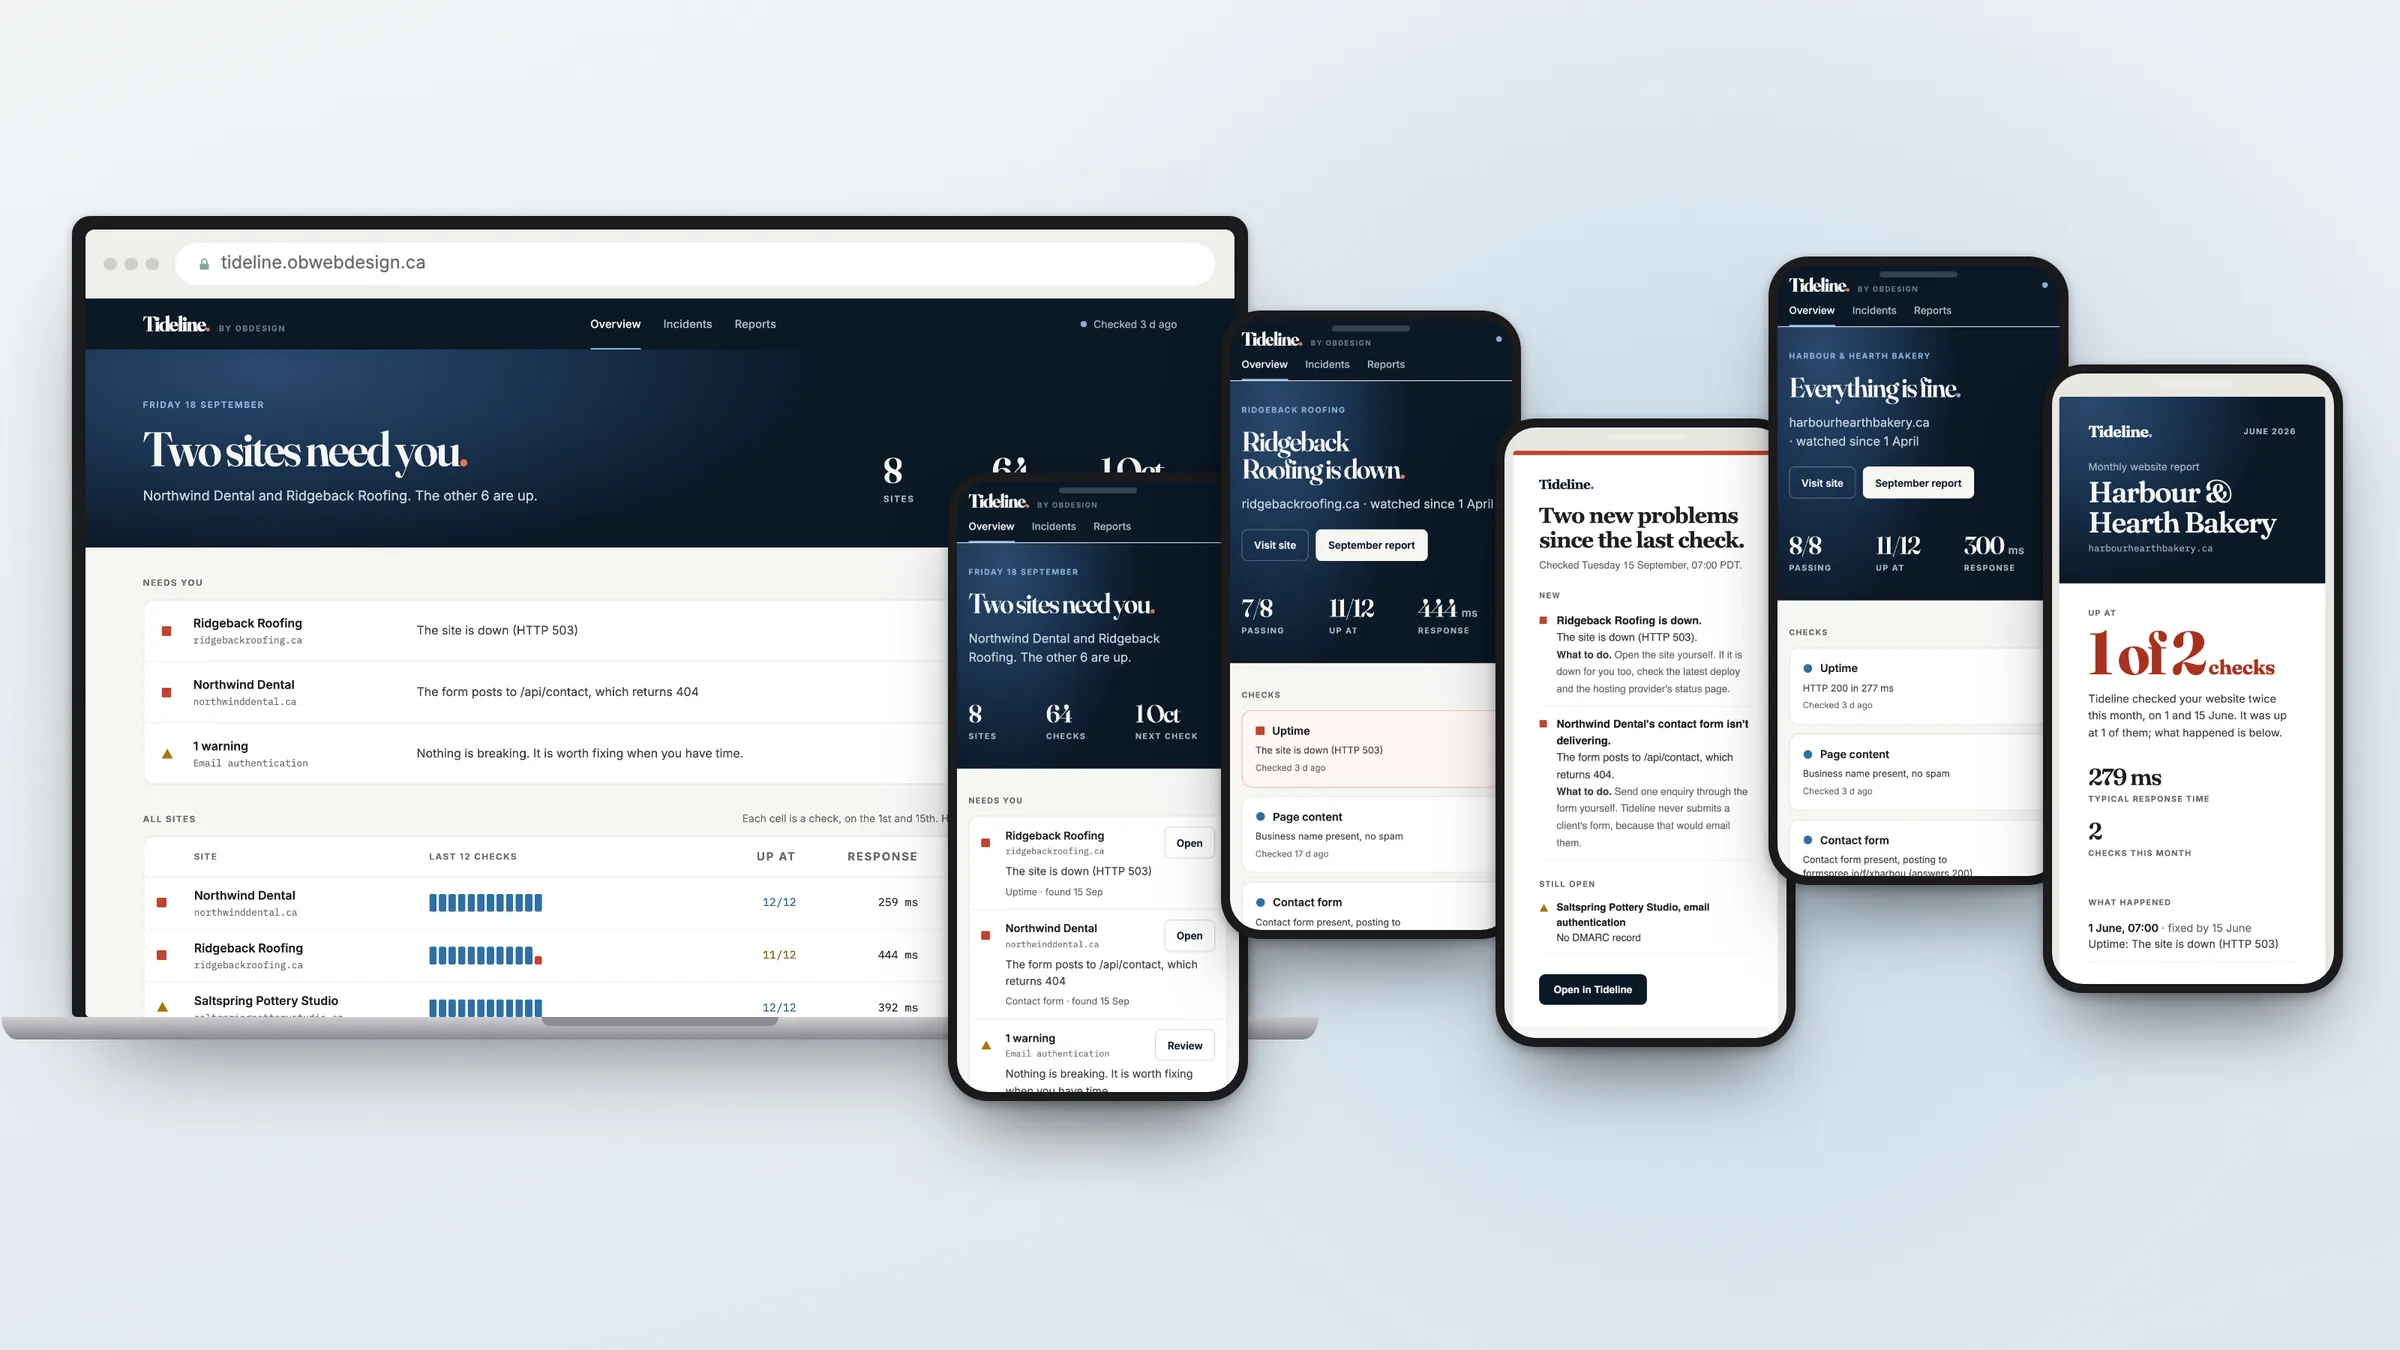
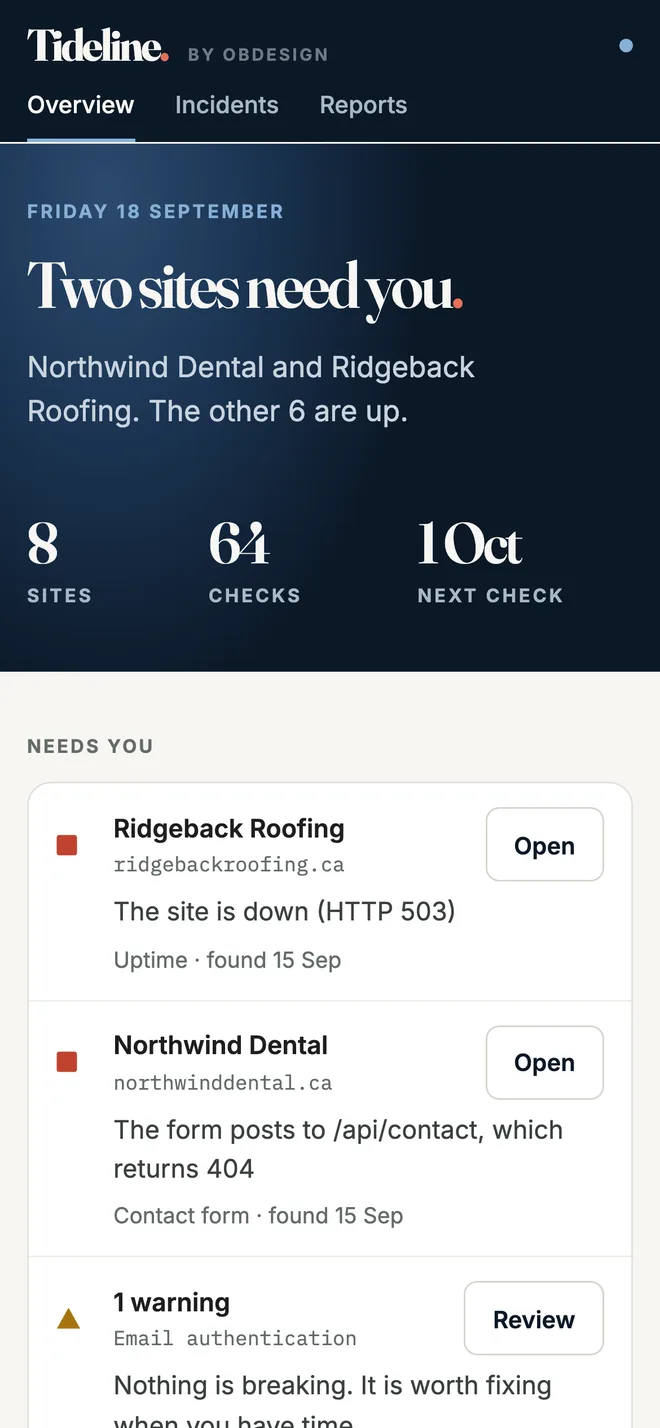
The real dashboard names real clients and lists their weak spots, so it stays private. The public demo runs the same product over eight invented businesses, and anyone can click around it without an account.
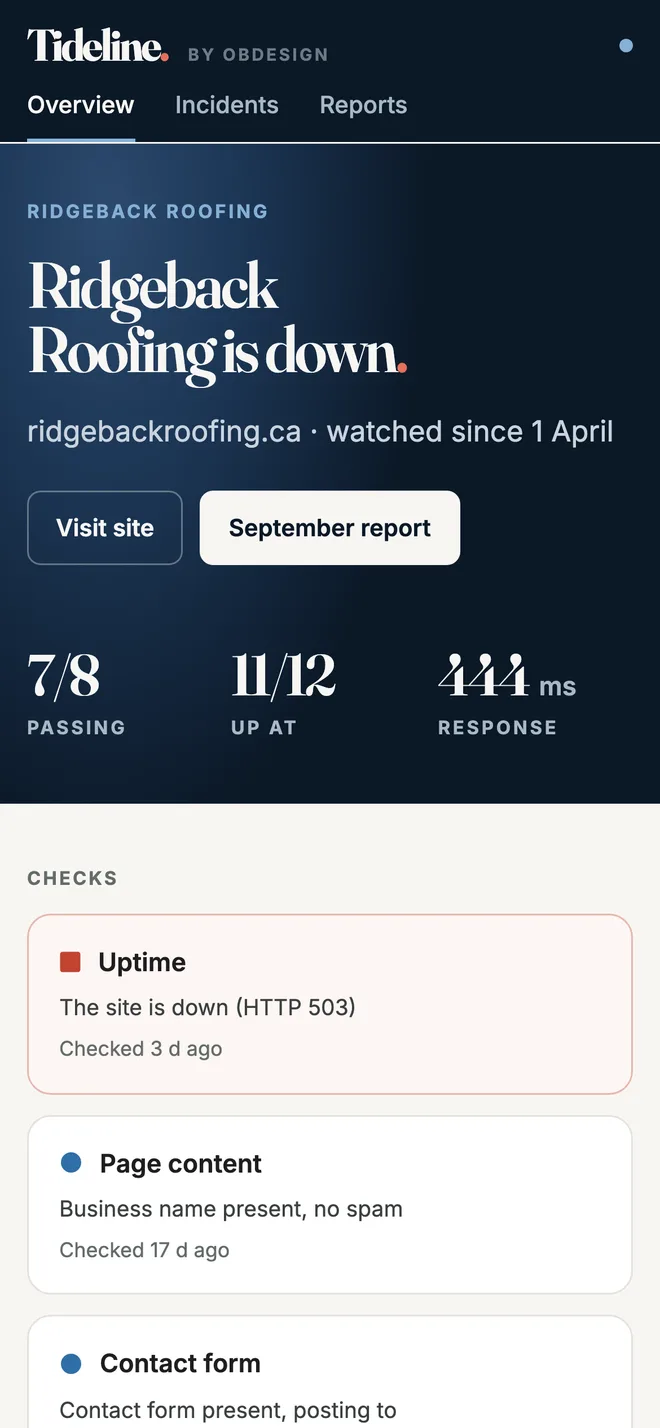
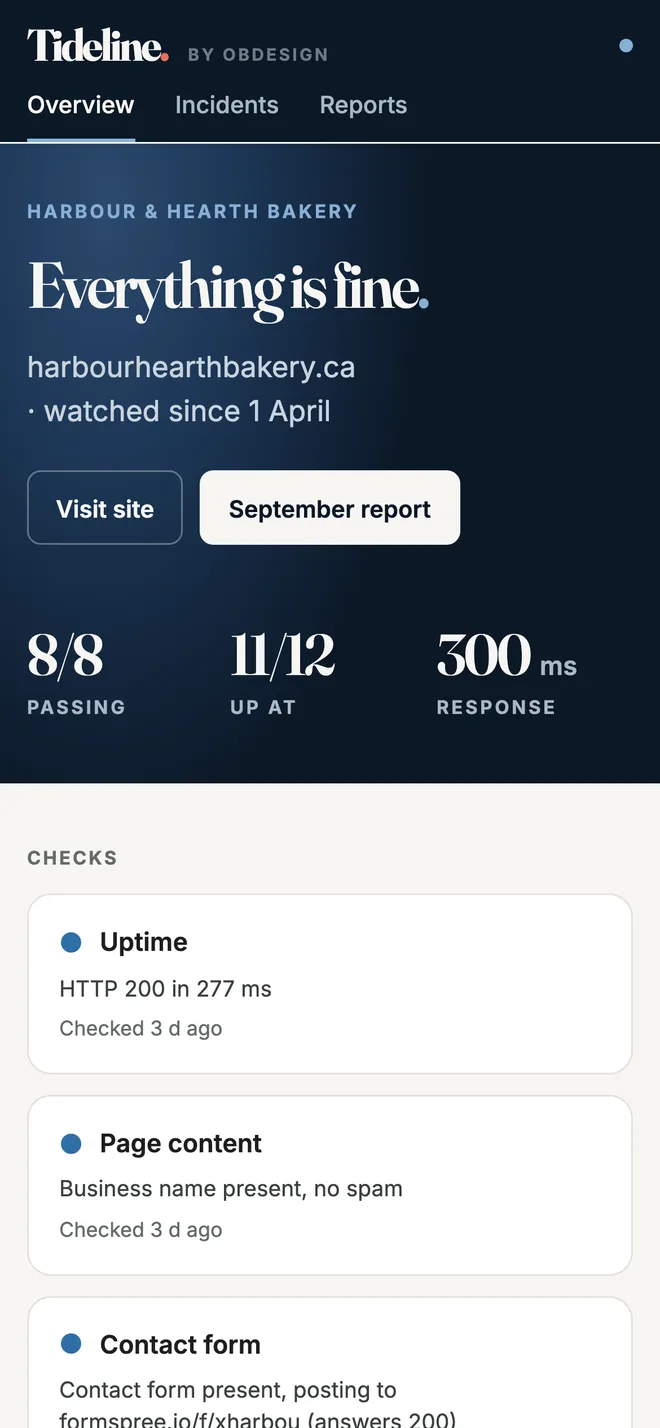
What it checks
It watches the 11 of those sites that I built. (The twelfth is ongoing care of a gym's existing Wix site, which Tideline doesn't watch.) Every site gets eight kinds of check, 86 in all.
| Check | What it catches |
|---|---|
| Uptime | The site is down, erroring, or too slow to answer. It retries once, 30 seconds later, before a failure counts. |
| Page content | The business name has gone missing from the page, or spam has been injected into it. That is how the hack on one client's old WordPress site showed up. |
| Certificate | The HTTPS certificate is invalid, or within 21 days of expiring. |
| Domain | The registration is within 30 days of lapsing, or on hold. Looked up over RDAP. |
| DNS | A record has changed from the baseline I last accepted. A change at the registrar can break a site's email without touching the site. |
| Email authentication | The domain has no SPF or DMARC record, so anyone can send mail that claims to be from it. |
| Links | A page links to something that no longer exists. It crawls each site slowly and confirms a failure before reporting it. |
| Contact form | The form is missing, or posts somewhere that answers with an error. It never submits the form, because that would email the client, and a test asserts it never sends a POST. |
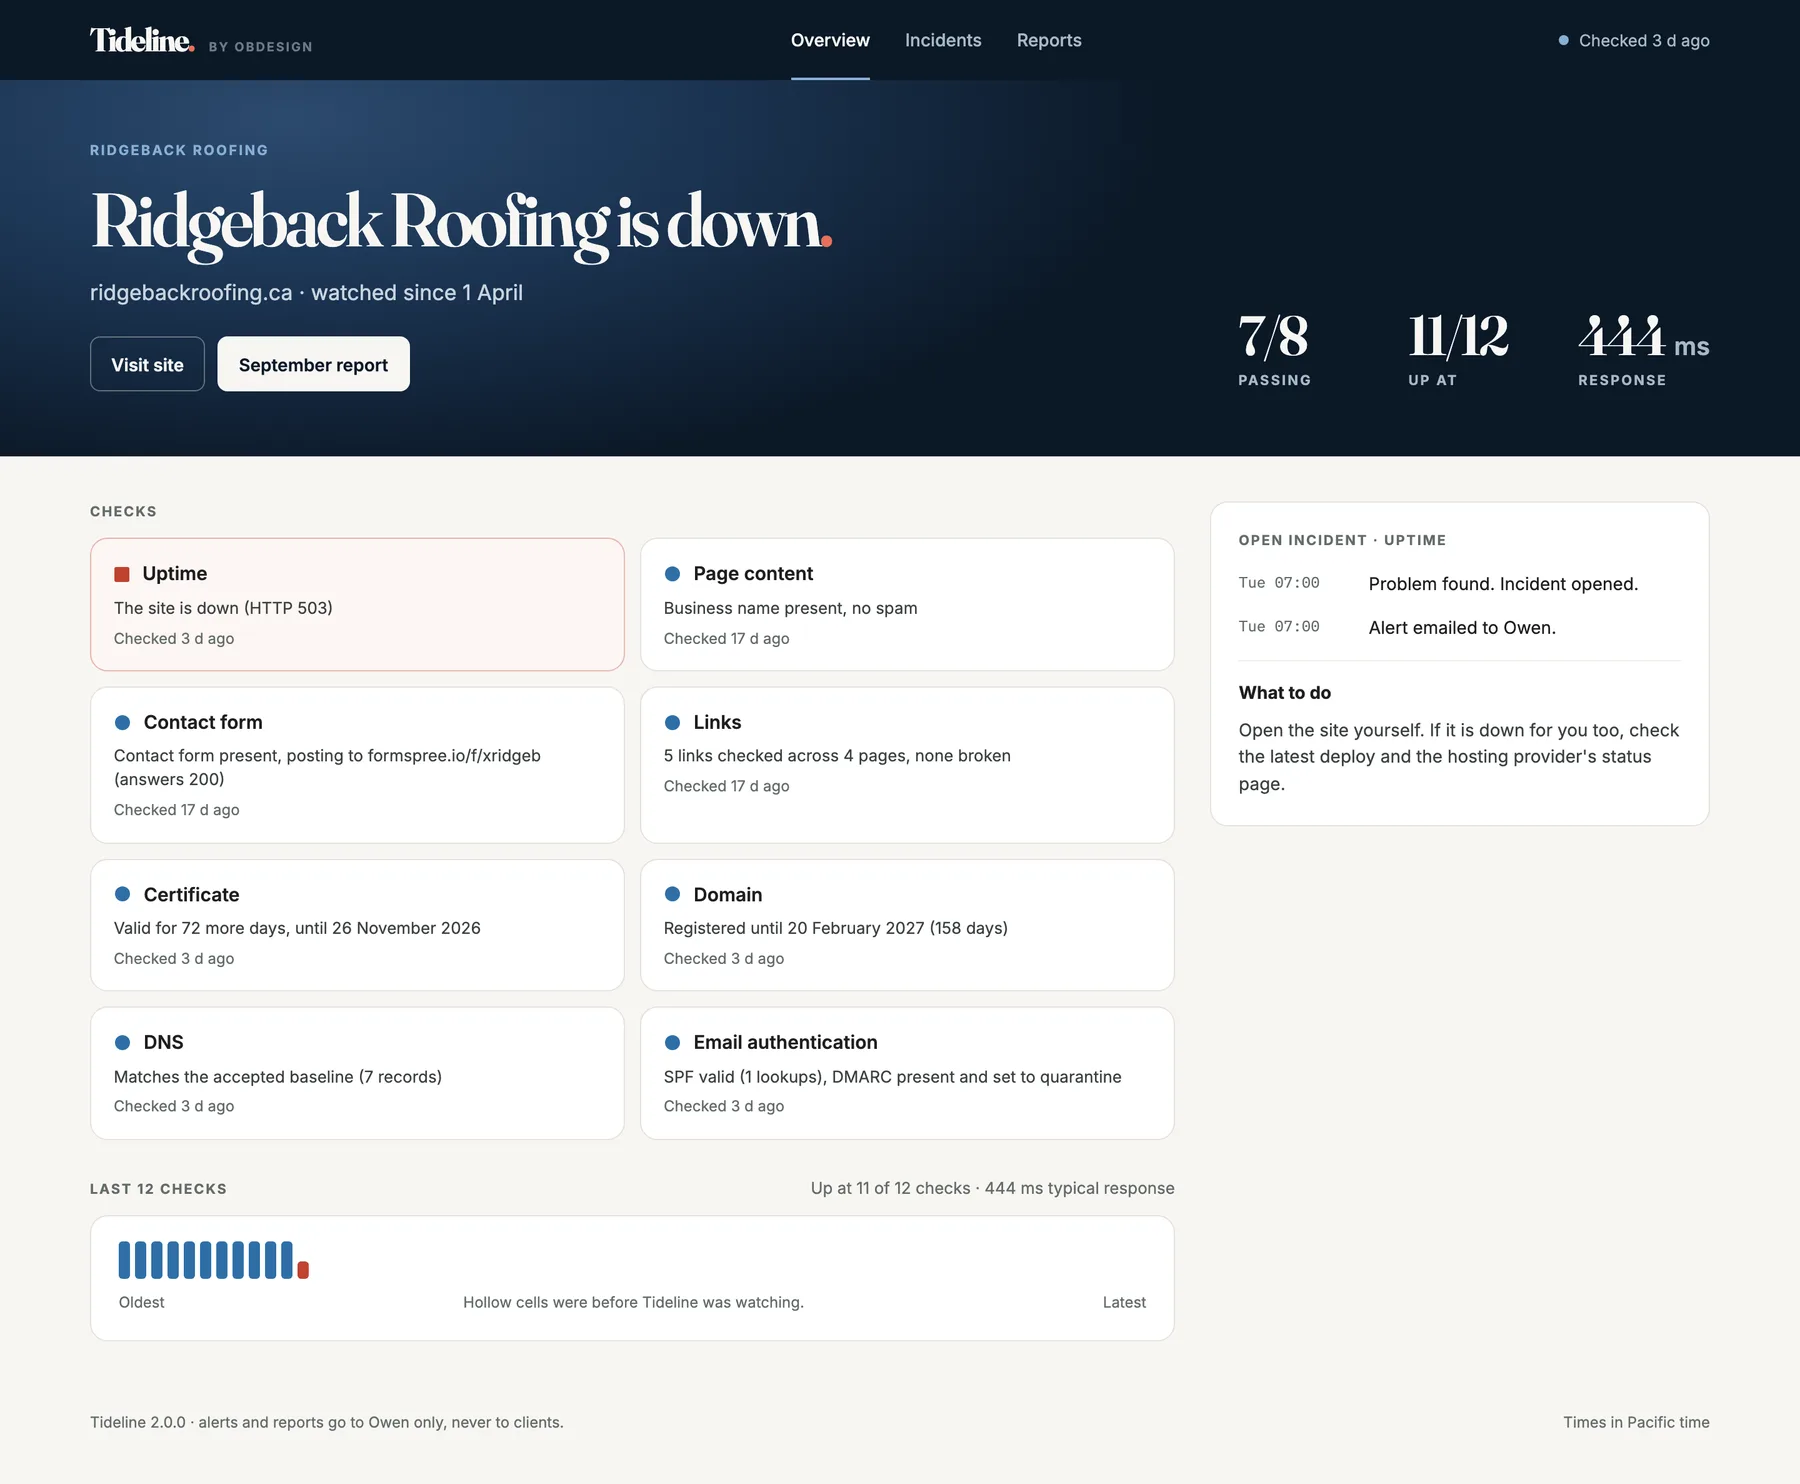
Every status is a shape, a word and a colour, never colour alone: a blue circle for up, an amber triangle for a warning, a red square for down. It reads in greyscale, and it reads to a screen reader.
The conventional version first
The first version went live on 17 September, and it was the textbook design. A Python worker checked every site every five minutes and wrote to Postgres, all in Docker on a Graviton EC2 server with Caddy handling HTTPS. Twenty-six AWS resources in Terraform, CloudWatch alarms, nightly backups to S3 with the restore tested twice, and deploys that roll themselves back when a health check fails. I proved that one by deploying a deliberately broken image and watching the previous one come back.
The part that taught me the most was the alarm that watches the watcher. If the worker died, a heartbeat alarm was supposed to email me. I stopped the worker on the live server to prove it, and the first configuration took about 25 minutes to fire. The second didn't fire at all in 23. CloudWatch waits for late data before it treats missing data as a problem, so the fix was an alarm on the heartbeat count with the gaps filled in as zero. Measured the third time: 11 minutes 52 seconds from stopping the worker to the email.
It cost about USD 20 a month.
Then the real requirement
The next day I set the requirement I should have set first. This had to cost under USD 3 a month, and checking twice a month was plenty. These are small-business sites that rarely change. If one goes down, the client or I notice within hours anyway. What nobody notices is the slow failure, and a slow failure doesn't need a five-minute check.
So I rebuilt it around that:
- 01ScheduleEventBridge Scheduler starts a run at 07:00 Pacific on the 1st and 15th
- 02Loada Lambda function downloads the database, one SQLite file in S3, and remembers which version it got
- 03Check86 checks across 11 sites, five at a time, each with its own deadline
- 04Decidethe incident rules open, escalate and resolve incidents. They are one pure function, with a unit test for every transition
- 05Saveupload the file only if nobody changed it in the meantime (an S3 If-Match upload), so nothing is ever silently overwritten
- 06Tellone summary email, only if something is new or fixed, and on the 1st a report for every site
Two Lambda functions from one arm64 container image: the scheduled run, and the FastAPI dashboard behind CloudFront. No VPC, because the functions only make outbound requests, and inside a VPC they'd need a NAT gateway at about USD 35 a month, more than ten times the whole budget on its own. The data came across with every row counted (11 sites, 2,687 results, 28 incidents), and one terraform apply removed the server and built the new setup. A full run takes about 21 seconds, and the whole thing is designed to run inside AWS's free tier.
One thing broke on the way. The dashboard had used the browser's built-in password box, which can't work behind a Lambda function URL: Lambda renames the header that asks for the password, and CloudFront won't run code on that response to rename it back. I found that by probing the live URL rather than in the docs, and gave the dashboard a real sign-in page with a signed session cookie.
The trade is real, so I'd rather say it plainly: an outage is now noticed at the next run, not within minutes. For a client paying for uptime monitoring, the first version is the right design, and it's still in the git history.
What it found on day one
The first full run found real problems across OBdesign's own client sites. Eight of the 11 domains were missing SPF, DMARC or both, so anyone could send email that claims to be from them. One client's contact form posted to an address that answers 404. One site had a broken internal link.
None of those were breaking anything that day, which is exactly why nobody had noticed. I'm not naming which sites: a list of domains that can be spoofed is exactly the list an attacker would want.
What it says, and what it won't
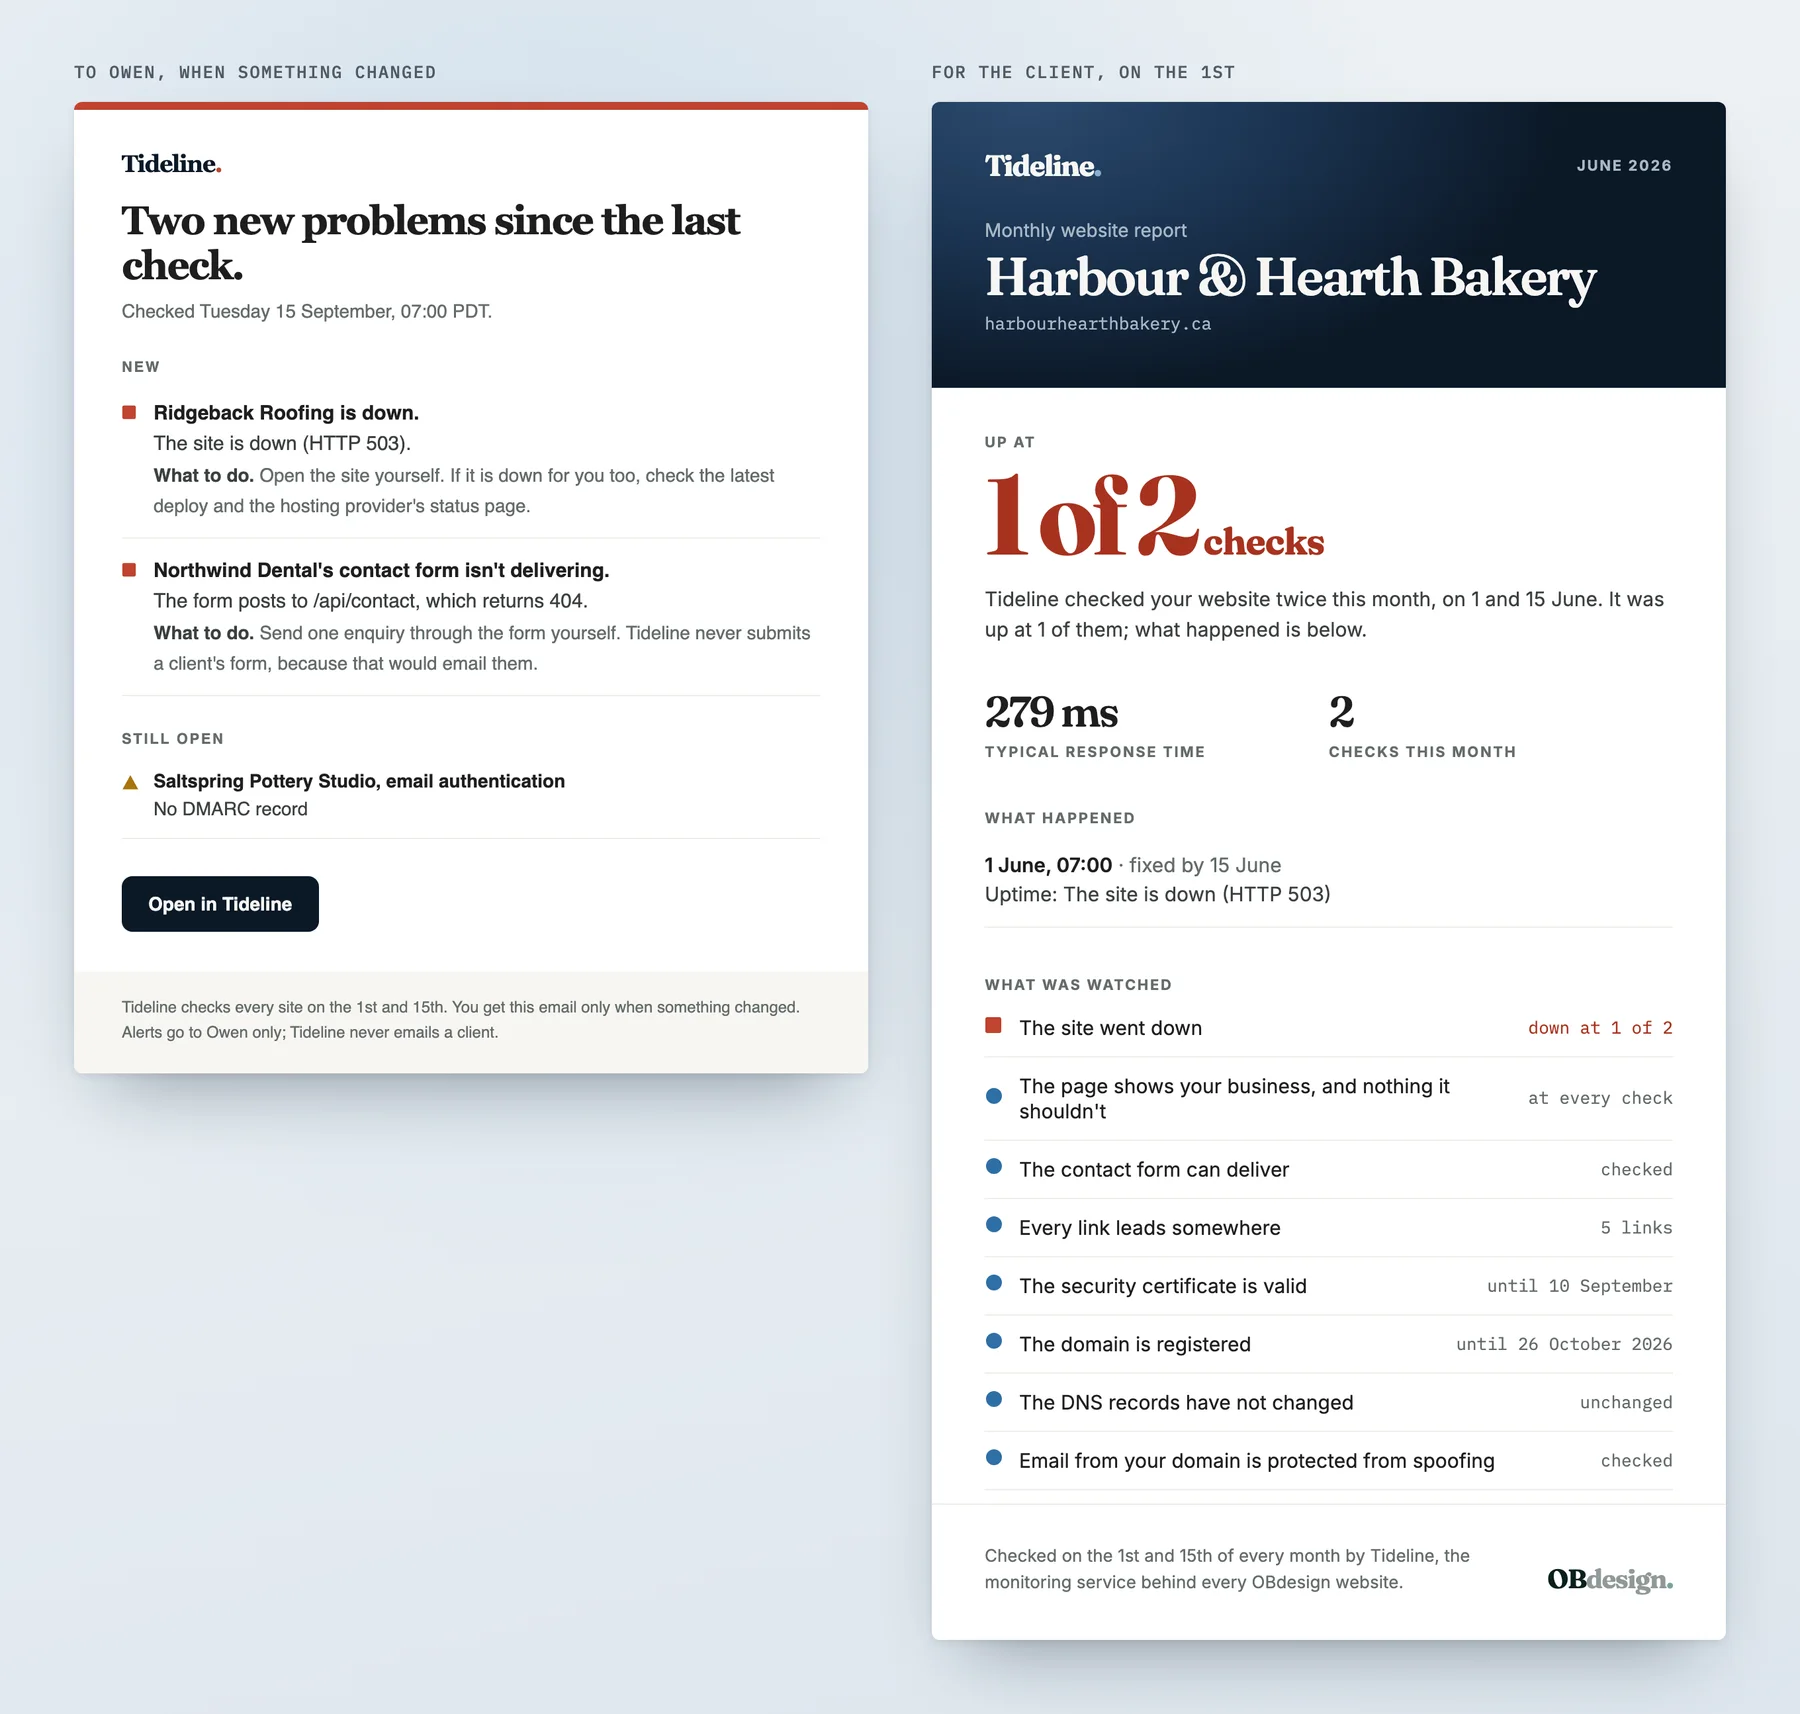
A run sends me one email, and only when something is new or fixed. Each problem says what's wrong in plain words and what to do about it. "Northwind Dental's contact form isn't delivering", not "form check failed". A quiet run sends nothing.
The monthly report is written for the client to read when I forward it, so it never uses a check's name. "Email from your domain is protected from spoofing" instead of "DMARC present".
Two checks a month can't support an uptime percentage, so Tideline doesn't show one. The dashboard and the reports say "up at 1 of 2 checks", and an incident reads "1 June, fixed by 15 June" instead of an outage duration it has no way of knowing. Every monitoring tool I'd looked at shows 99.9%. Copying that would have put a number on the page that nothing measured.
Having it reviewed
Before calling it done, I had two independent reviews run against the code, one for security and one for correctness, without either seeing my threat model's conclusions. Neither found anything critical or high, and every medium finding was fixed with a test the same day. Two are worth telling.
A hacked page could have stalled a run for hours. Links and forms were found with regular expressions, and the review measured those patterns slowing with the square of the page's size. A 3 MB page of crafted HTML would have kept a run busy for hours, and CPU work like that can't be interrupted by a timeout. They're now found with Python's own HTML parser, which reads a page once, start to end, so its time grows only with the page's size.
Emails went out before results were saved. If saving then failed, the next run would see the same problem as new and email it again. Now a run saves first and emails second, an alert is recorded as sent only once its email has actually gone, and a failed email fails the run so the alarm fires.
The security review also caught my own threat model claiming the link crawler never left a client's site. It does: external links get checked too. The document was wrong, and now it isn't.
The demo
The real dashboard can't be public, but screenshots alone don't prove a product is real. So the demo is made by the product itself. A tideline showcase command replays six months of scheduled runs through the real code against a simulated web. Pages, forms, links and the domain registry answer through a mock HTTP transport, and DNS through a fake resolver, following a script: an outage and its recovery, a broken link fixed, a DNS change accepted, a missing DMARC record. The eight businesses are invented, and I checked that none of their domains are registered.
A third Lambda function serves it with its own role, which can read the demo database and nothing else: no real data, no secrets, no email. CloudFront only lets reads through, and the demo rebuilds every morning so "checked 3 days ago" stays true.
What I'd do differently
Ask what it needs to do before building it. The first version wasn't wasted: running a real server, backing it up, restoring it and chasing an alarm that didn't fire taught me things the serverless version never would have. But I built an always-on system for a problem that only needed a twice-monthly one. Cost and frequency were the two questions that decided the whole design, and I asked them a day late.
And be careful about what a monitor claims. The hardest thing to get right wasn't a check. It was the words. A number on a dashboard looks like a measurement, so every number Tideline shows has to be one.